Morphology characterization of cotton fibers
One slide with two similar cross sections of the same cotton fibers specimen is submitted to determine the sphericity distribution of the fibers.

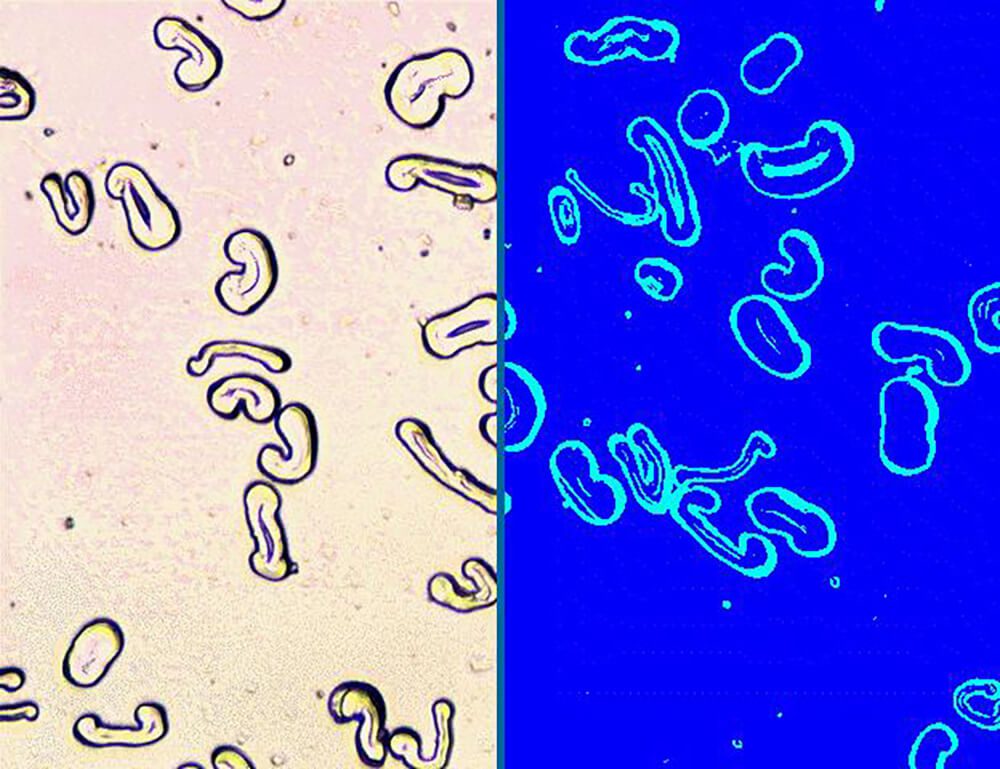
Figure 1. Left: Original image at 400x with a calibration factor of 0.3342 µm/pixel. Right: Binarization by Gray Thresholding of the original image. Background and cotton fibers are detected in blue. Whereas the outline and lumens are binarized into cyan.

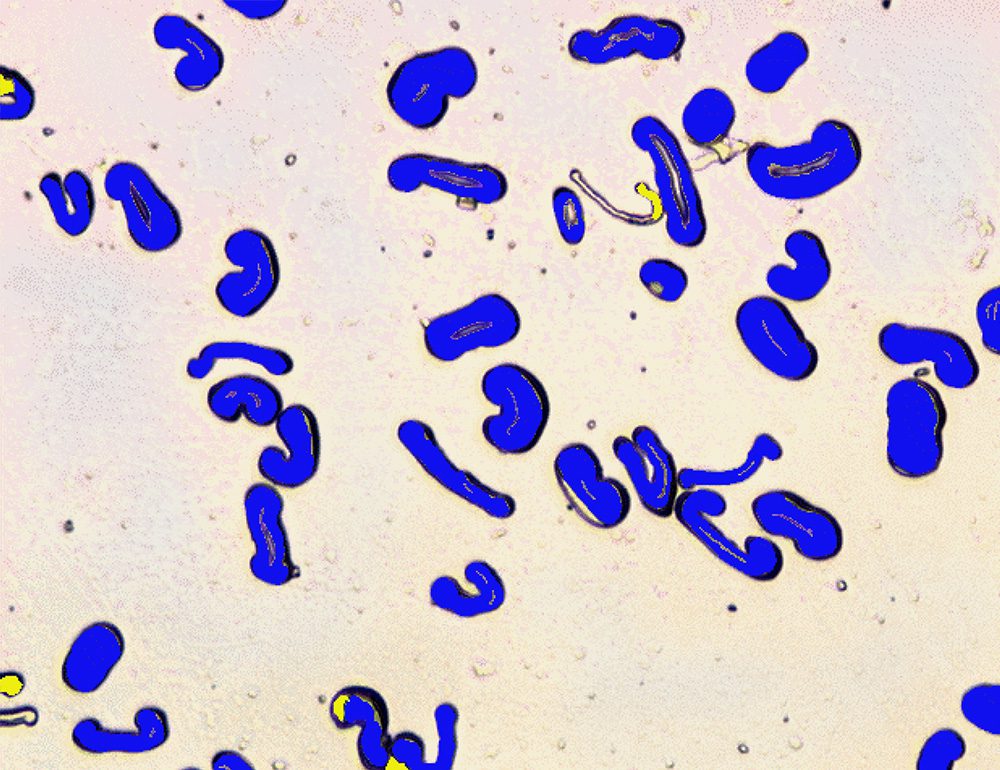
Figure 2. Final image before measurement. Several binary transformations are necessary to obtain a satisfactory representation of the cotton fibers without lumens and to remove artifacts.
PURPOSE
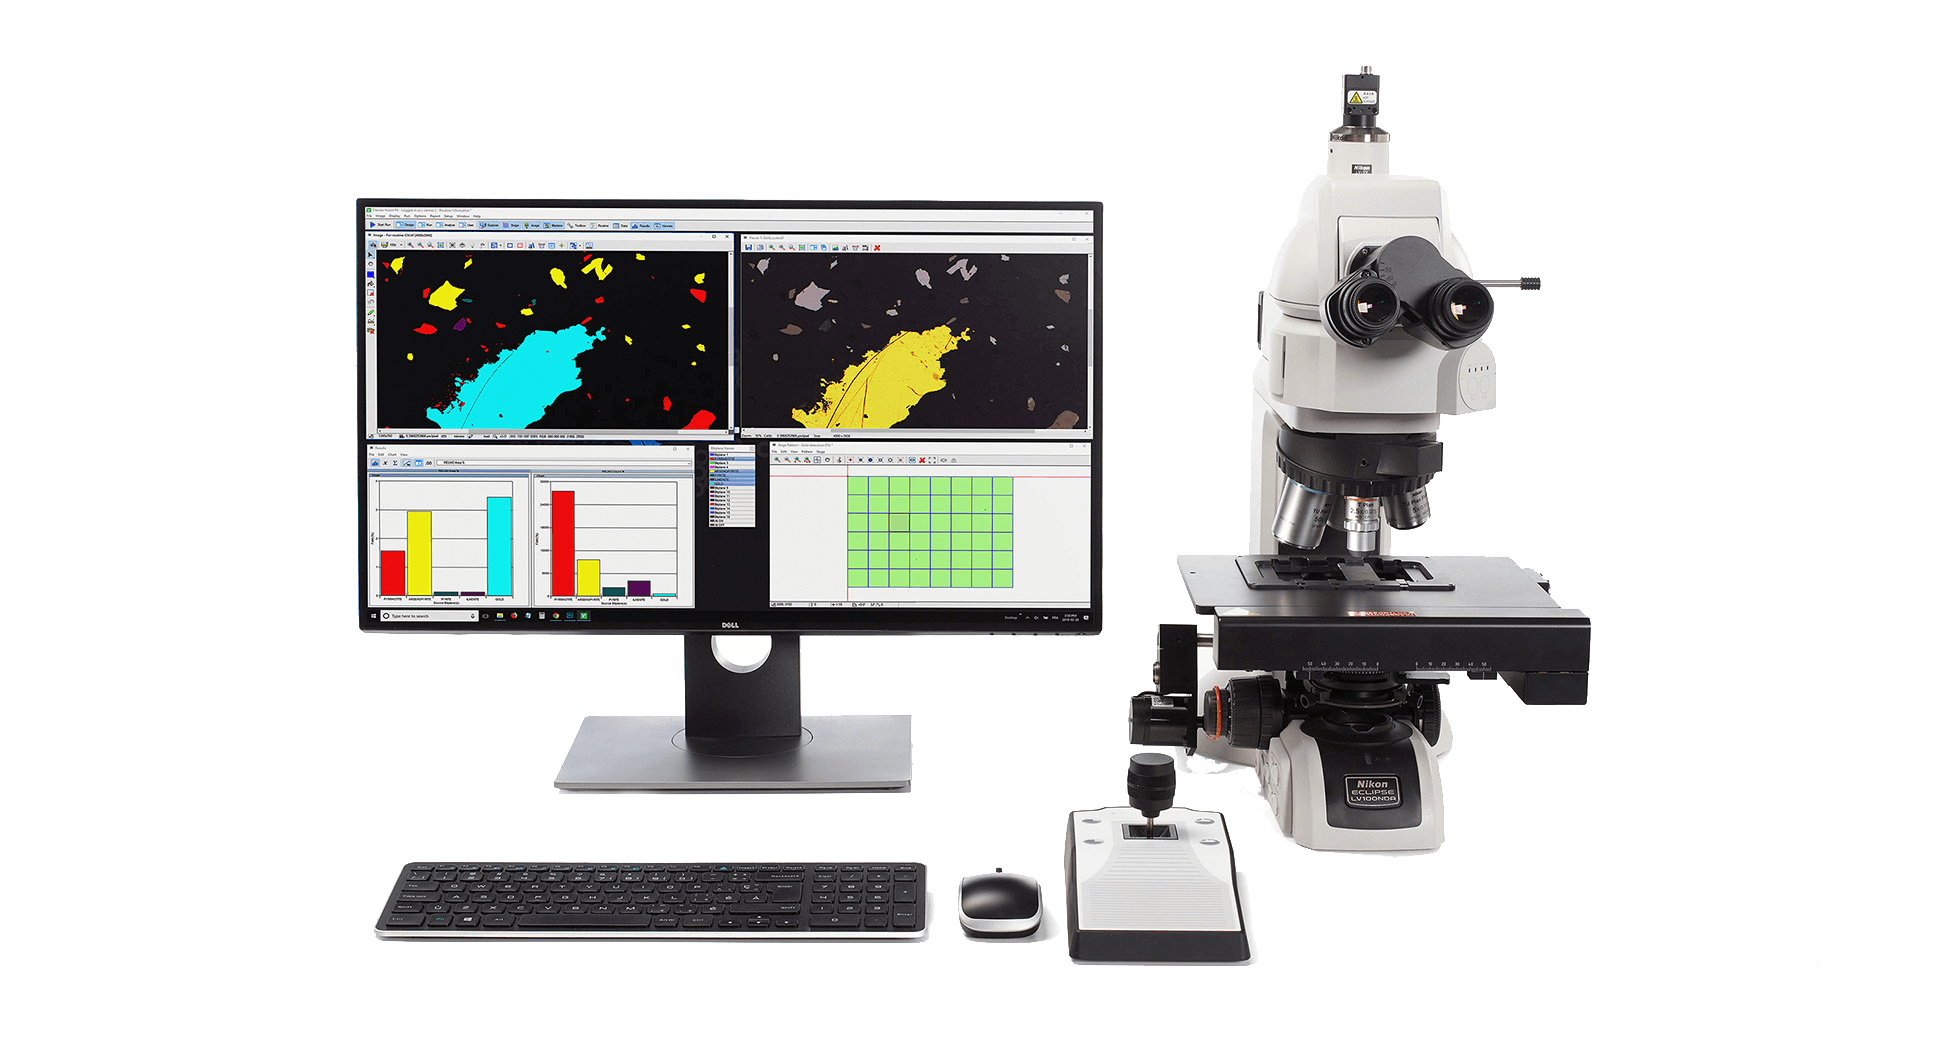
Demonstrate the ability of the Clemex Vision image analysis system to automatically discriminate cross section of cotton fibers (without lumens) and analyze surface and shape. The methods and operations used are discussed in the report linked at the bottom of this page (click the Download PDF link below).
RESULTS
A Guard Frame was applied to eliminate all incomplete objects at the edges of each field. Objects that are eliminated are necessarily analyzed in a subsequent field since the stage moves in guard frame size steps. A distribution of the sphericity is shown in the graph. Final results can be printed directly from Clemex Vision. Raw data are linked to their respective objects for validation purpose. Raw data can also be exported in Excel format.


