Pollen density analysis
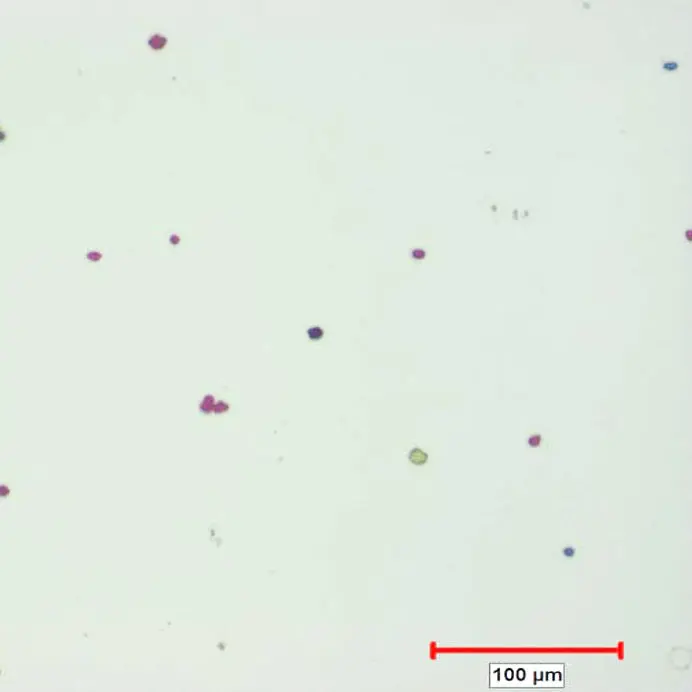
Two slides with pollen particles are submitted for analysis. Slide 10/06/08 is identified as sample 1, and slide 17/04/08 is named as sample 2.
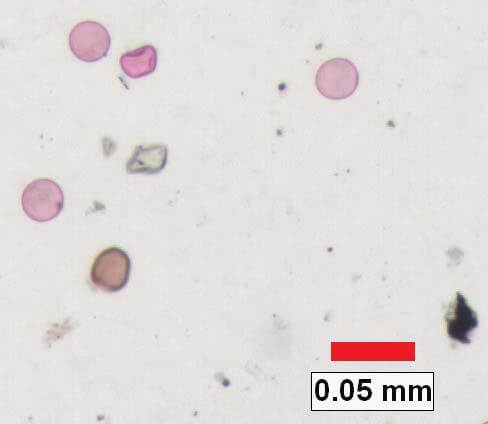
Figure 1. Since pollen particles are found at different focus planes, a Multilayer Grab is used to capture the image.
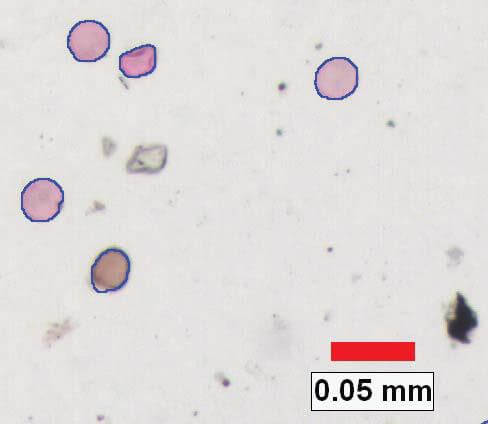
Figure 2. Binary operations are performed to eliminate undesired features. Outlines of pollen particles are highlighted. The density of pollen is measured in blue bitplane.
PURPOSE
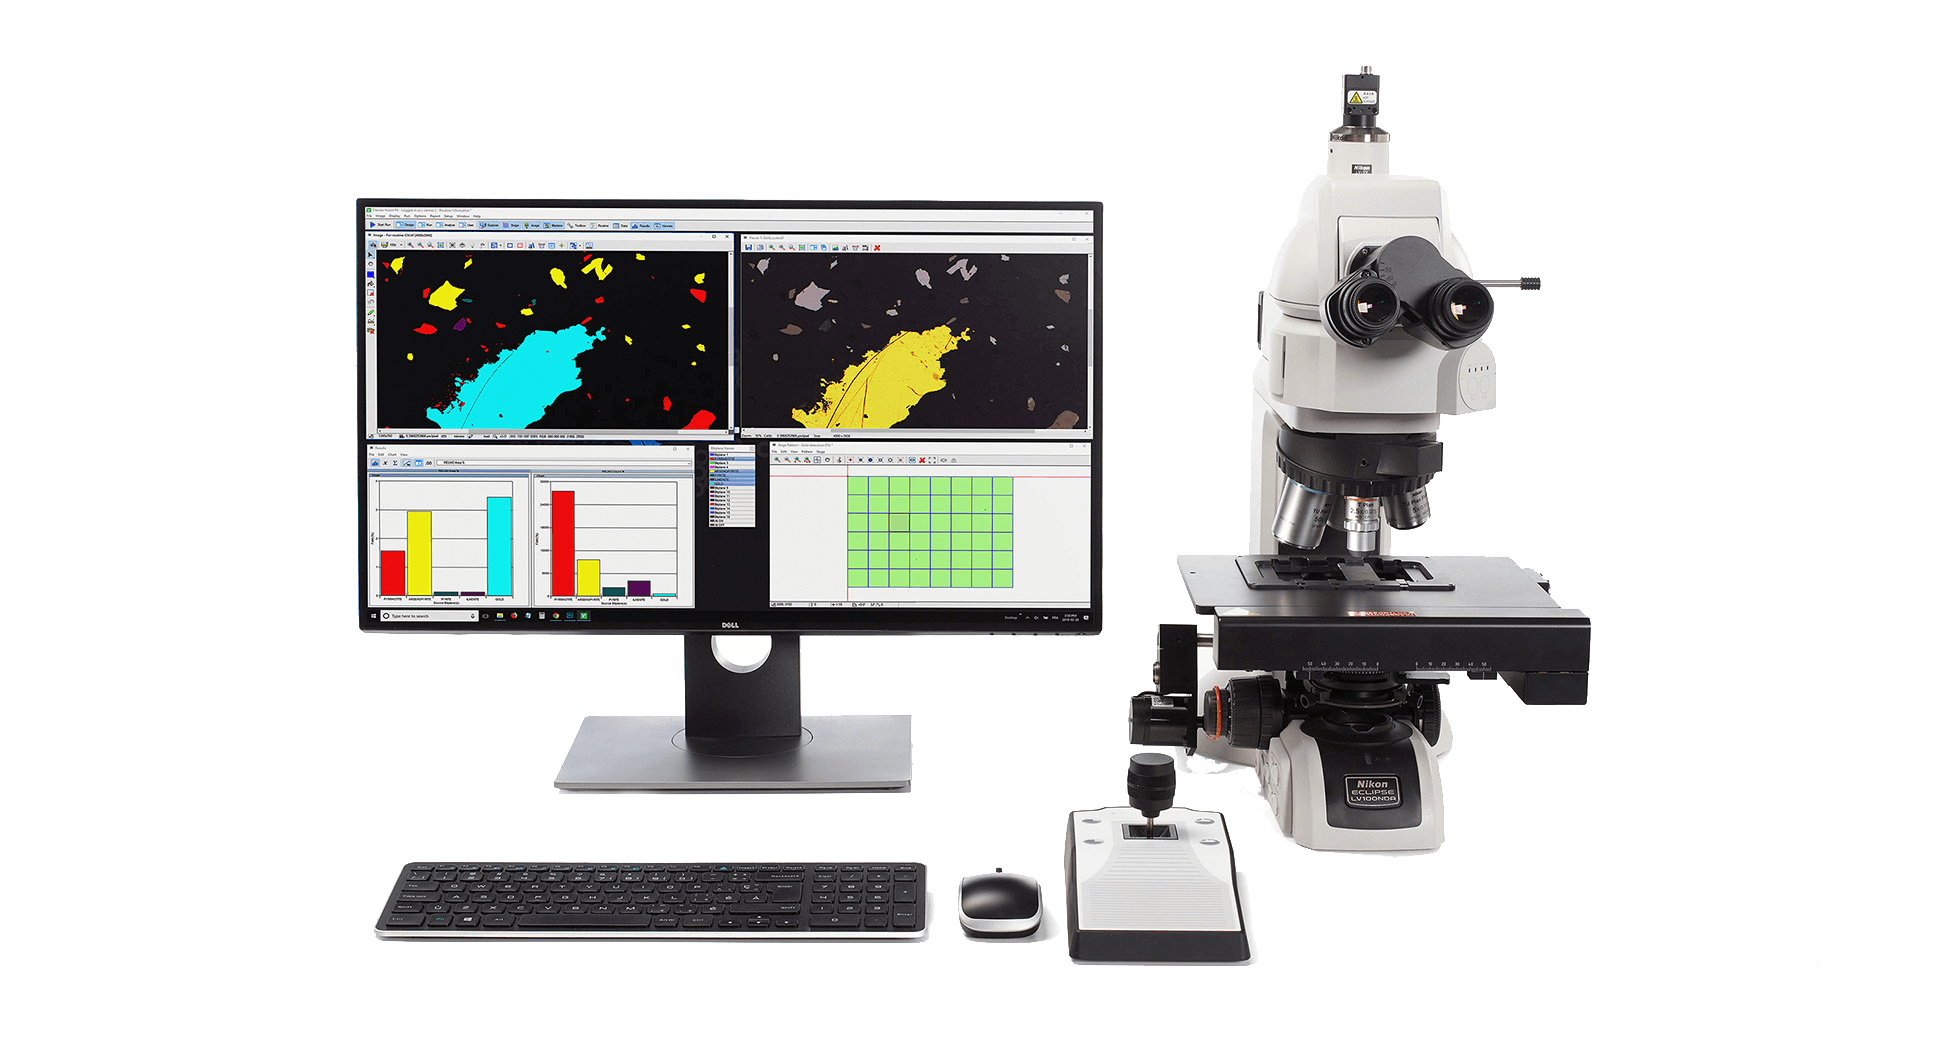
Demonstrate the ability of Clemex Vision image analysis system can distinguish pollen particles and evaluate their density. The methods and operations used are discussed in the report linked at the bottom of this page (click the Download PDF link below).
RESULTS
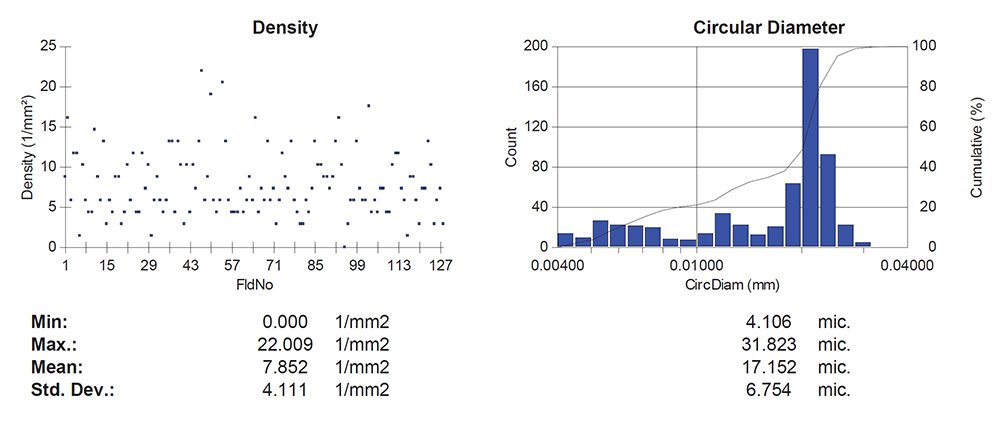
Circular diameter and density were measured on each field. Many other measurements are available to quantify particles. Automated statistics and graphs were generated. Final results can be printed directly from Clemex Vision. Raw data are linked to their respective objects for validation purpose. Raw data can also be exported in Excel format.