Porosity Analysis in aluminum
One aluminum sample is submitted for image analysis. Vision PE is used to determine the area of the pores and porosity percentage of the sample.

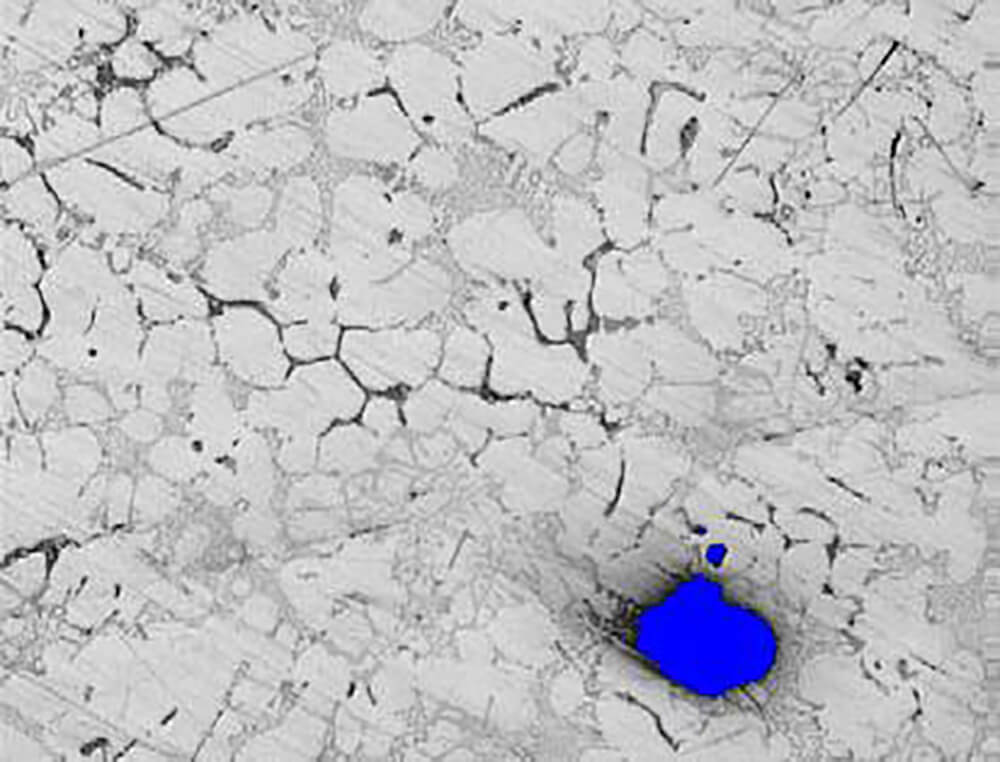
Figure 1. Original submitted aluminum sample is viewed at 100X. The pores are binarized into blue bitplane (Gray Thresholding).

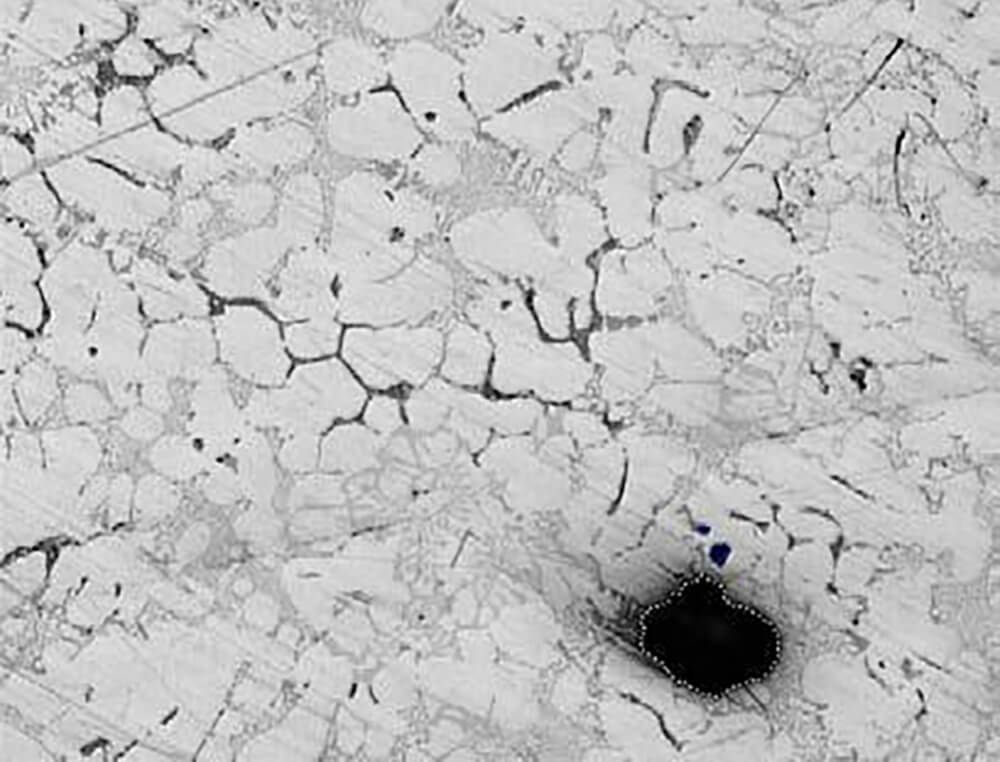
Figure 2. Individual measurement can be traced from Mapping View mode. The selected object is highlighted by a dotted line.
PURPOSE
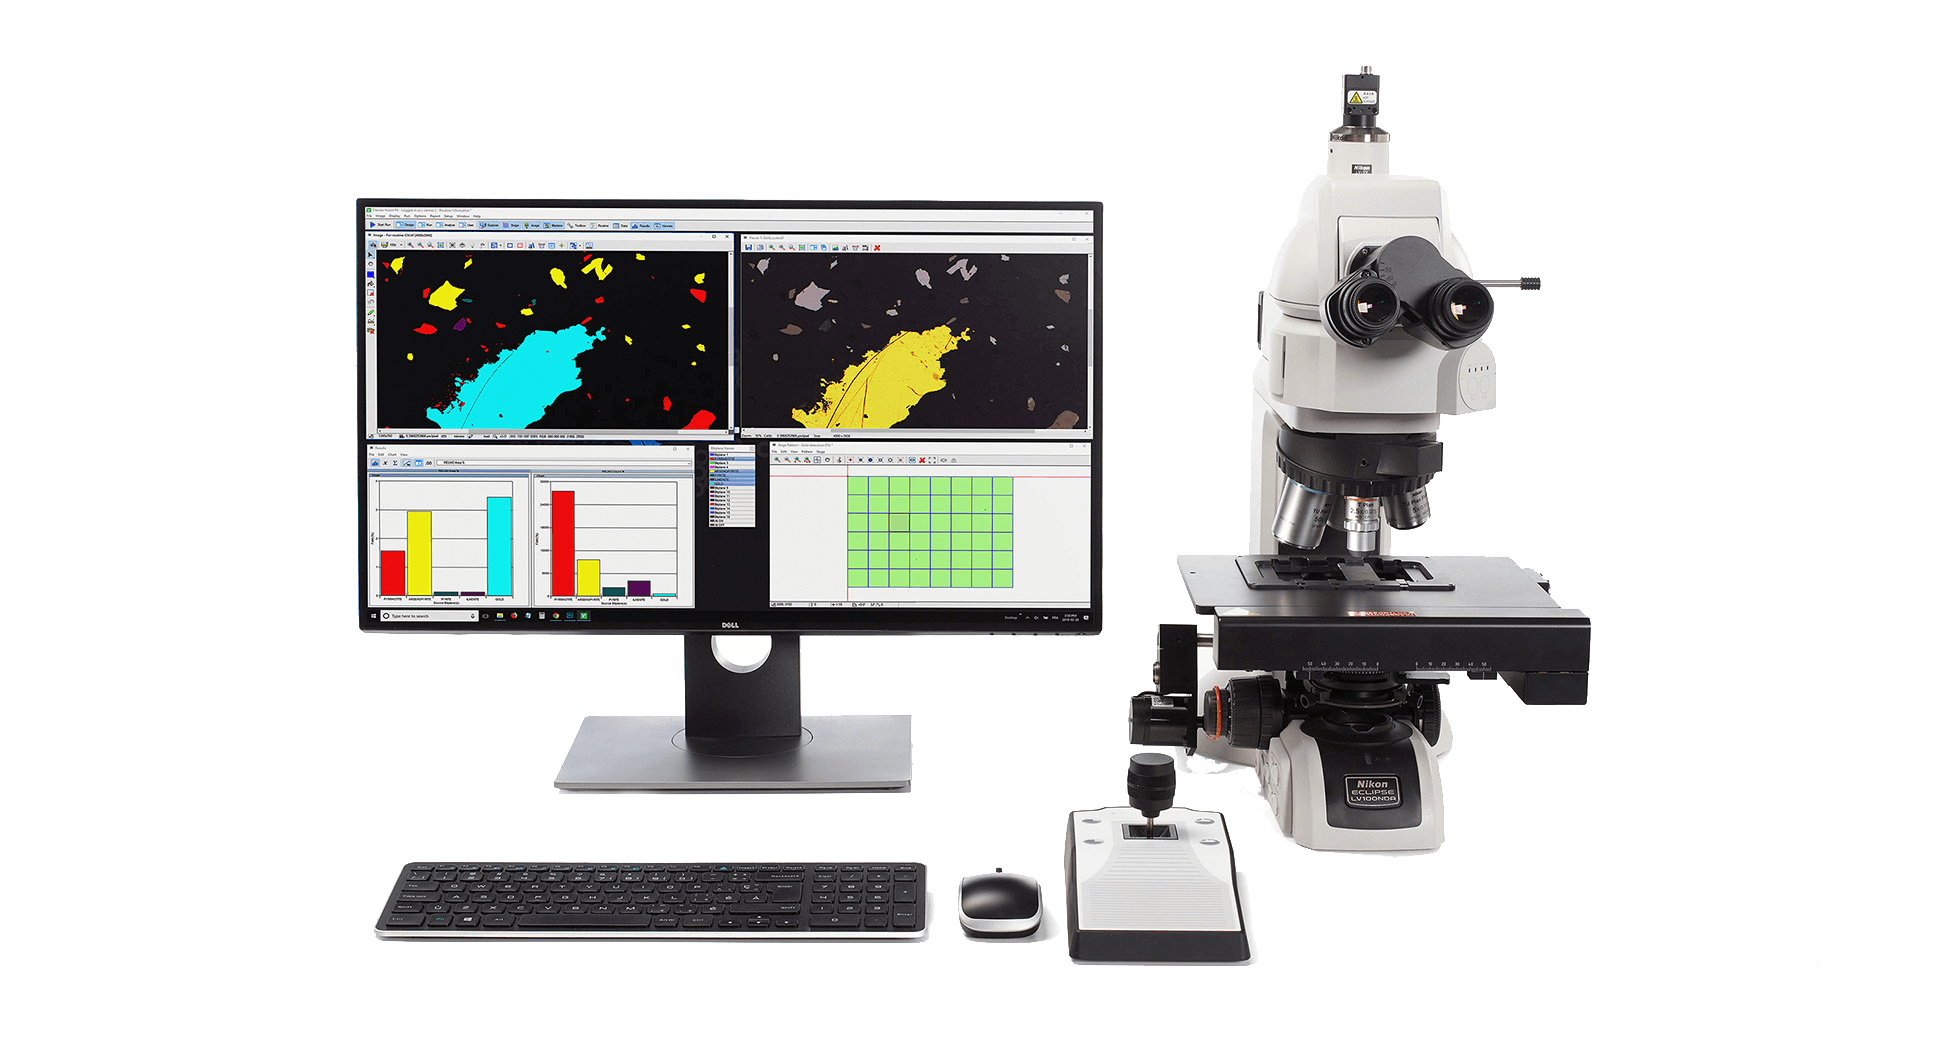
Demonstrate the ability of the Clemex Vision image analysis system can discriminate and measure the porosity percentage in the field of view. The methods and operations used are discussed in the report linked at the bottom of this page (click the Download PDF link below).
RESULTS
The area and area percentage of pores in submitted aluminum alloy are measured. Automated statistics and graph are generated and cumulated during the analysis of the sample. Final results can be printed directly from Clemex Vision. Raw data are linked to their respective objects for validation purpose. Raw data can also be exported in Excel format.


