Grain Size Characterization of Aluminum Alloys
In this report, image analysis is used to determine the grain size distribution for seven specimens of anodized aluminum: three samples of Al + 1.0 Si, two of Al + 1.0 Si + 0.5 Cu and two others of Al + 0.5 Cu.

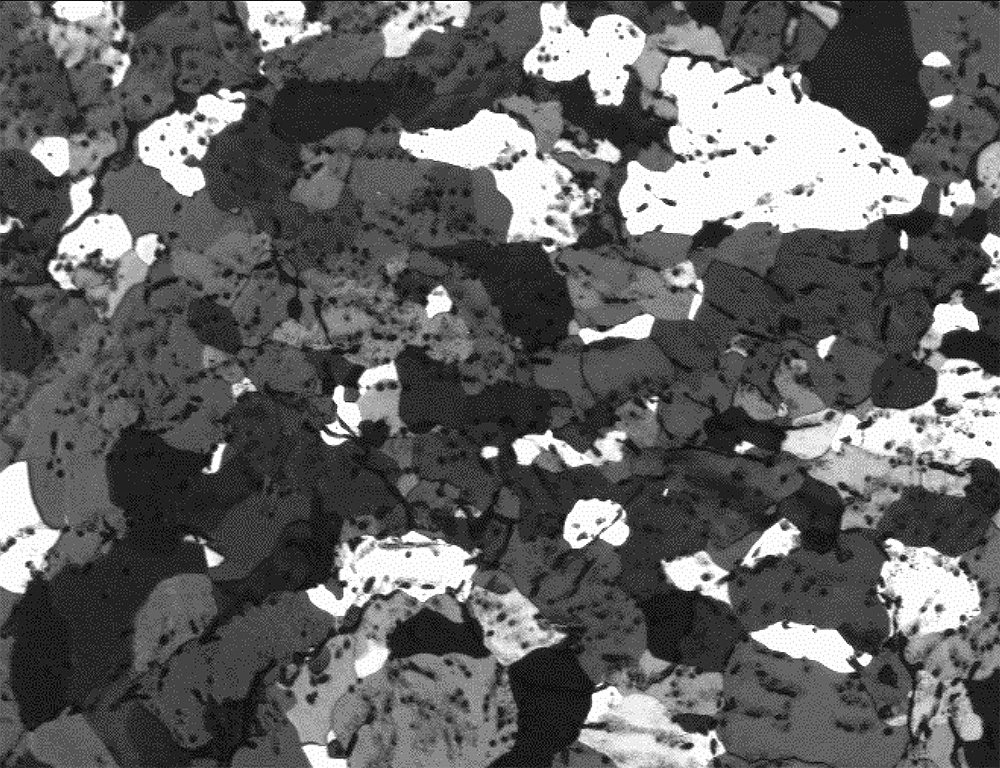
Figure 1. A typical image of aluminium grains, captured with a 40X magnification objective for this analysis. The calibration factor is 2.9940 microns/pixel. The analysis required a polarized light and was performed on 9 fields. Each field covered 2 626 842 µm2 (approx. 2.63 mm2) of the sample.

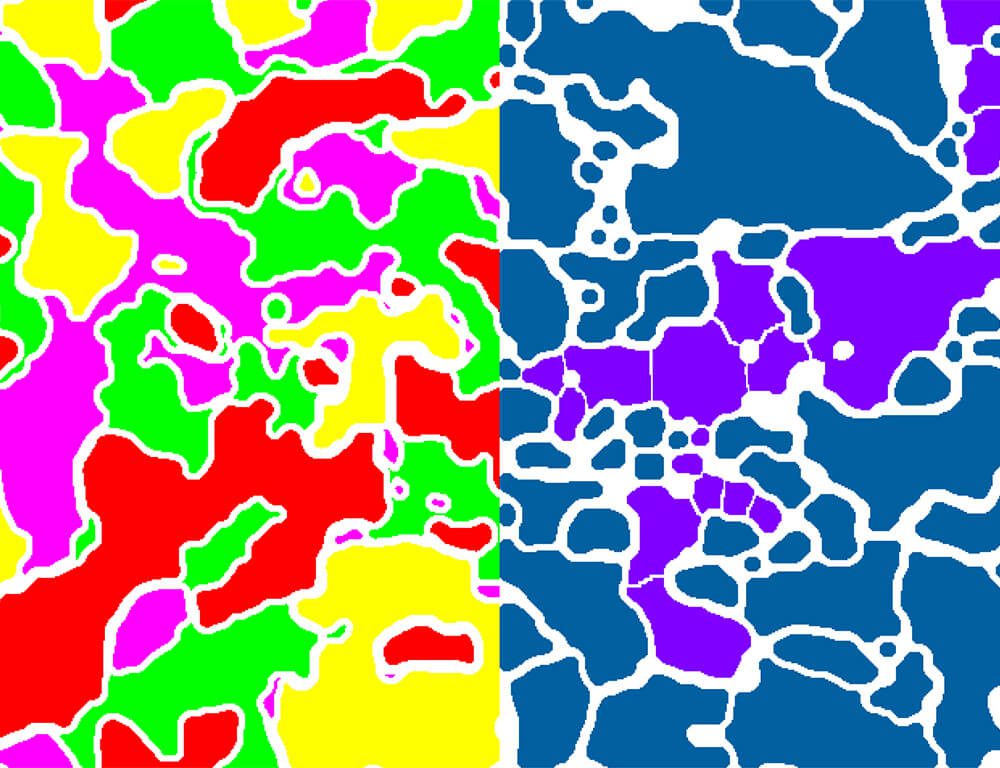
Figure 2. Preliminary grain discrimination (left). Rough grains are isolated and subdivided (right) before performing ASTM E112 measurements.
PURPOSE
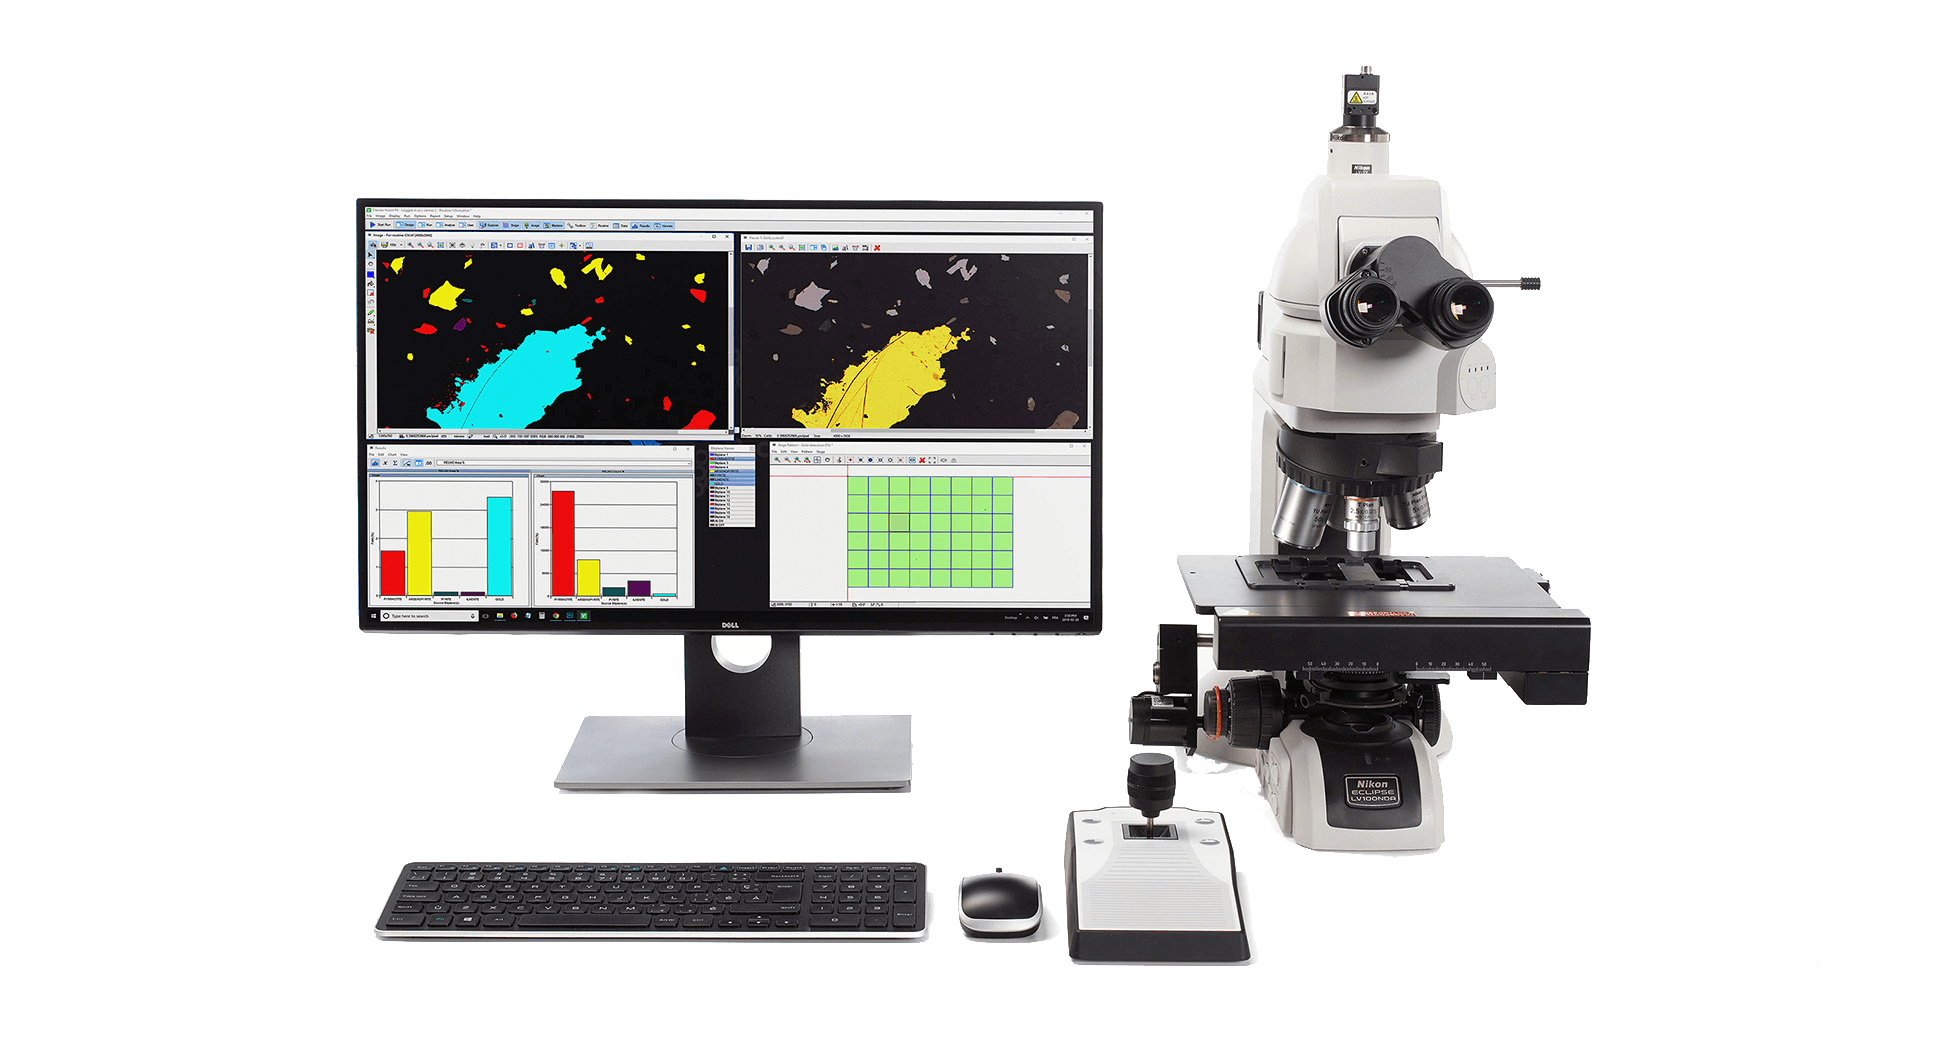
This study demonstrates the ability of Clemex Vision PE to discriminate and measure all grains and precipitates in the field of view. The discussion that ensues explains the challenges involved in this analysis.
RESULTS
Grain size measurements (ASTM E112) by objects and by fields were performed. Statistical graphs and a result summary can be exported directly from the software.


